It Is Only Slightly More Complicated than More Buyers than Sellers
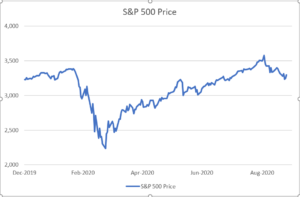
The S&P 500 closed Friday at 3298, down 1% on the week and 8% off its recent high set on September 2nd. Year-to-date, the S&P 500 is up 2% (not including dividends) and up 47% from its March 23rd low of 2237. Every move in the market is analyzed for a rational cause, even though sometimes none exists. The cause of broad and lasting moves is easier to explain than daily fluctuations. The first two months of 2020 was all roses as a durable economic expansion underpinned the market. Then came COVID-19, massive economic displacement, and equally massive stimulus. As of September 2nd, the S&P 500 was trading 11% higher on the year – what fueled the market rising to such heights? More buyers than sellers, of course.
This is actually an inaccurate colloquialism because it is an incomplete statement. For every buyer there must be a seller, and vice-versa. The accurate statement is “there are more buyers than sellers at this price.”

Source: Factset. The S&P 500 Composite Stock Price Index is a capitalization-weighted index of 500 stocks intended to be a representative sample of leading companies in leading industries within the U.S. economy.
A recent academic article by Gabaix and Koijen, of Harvard University and The University of Chicago respectively, attempts to shine light on market movements beyond those easily explained by fundamentals. In their paper, In Search of the Origins of Financial Fluctuations: The Inelastic Markets Hypothesis, the professors hypothesize that every $1 invested into the market increases the market’s aggregate value by about $5. The authors find that there is very little demand elasticity for equities; if stocks rise 5% in value, demand for those stocks only drops 1%.
Why do I risk boring you with arcane economic jargon? Because the paper’s conclusion lends credence to this year’s so-called Robinhood-effect. Retail investors have poured into the markets this year, as evidenced by the meteoric rise in Robinhood trading accounts, and increased retail participation partially explains some of this year’s market moves. “E*Trade Financial Corp., TD Ameritrade Holding Corp., and Charles Schwab Corp. each saw record sign-ups in the three months ending in March, with growth continuing thereafter and clients trading more than ever in the second quarter. Robinhood said in May that 3 million new funded accounts were added in 2020, with half of the new customers being first-time investors.”
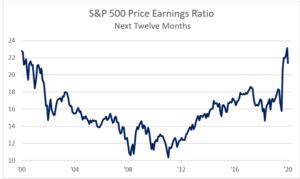
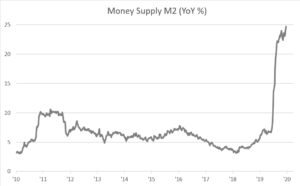
Day-by-day stock prices are determined by flows and sentiment in a high-finance popularity contest. But as days string into weeks, months and years, we believe fundamentals and valuation matter most. Based on FactSet estimates, the S&P 500 currently trades over 21x expected earnings, its highest multiple since 2001. Even adjusting for COVID-19-depressed earnings, the market is expensive by historical measures, yet prices could continue to rise if investors keep adding to their equity holdings. The liquidity is certainly available to do so. Money supply has grown at a never seen before rate, and based off Messrs. Gabaix and Koijen’s Inelastic Market Hypothesis, it takes only a little liquidity to derive a lot of stock gains.

Source: Factset Research Systems
M2 is a measure of the money supply that includes cash, checking deposits, and easily convertible near money. M2 is a broader measure of the money supply than M1, which just includes cash and checking deposits.

Source: Factset Research Systems
Credit: Tim Hoyle - Haverford

