

Midterms and markets
Key takeaways
Different parties, similar returns
Throughout history, we’ve seen the stock market advance under both Republican and Democrat presidents.
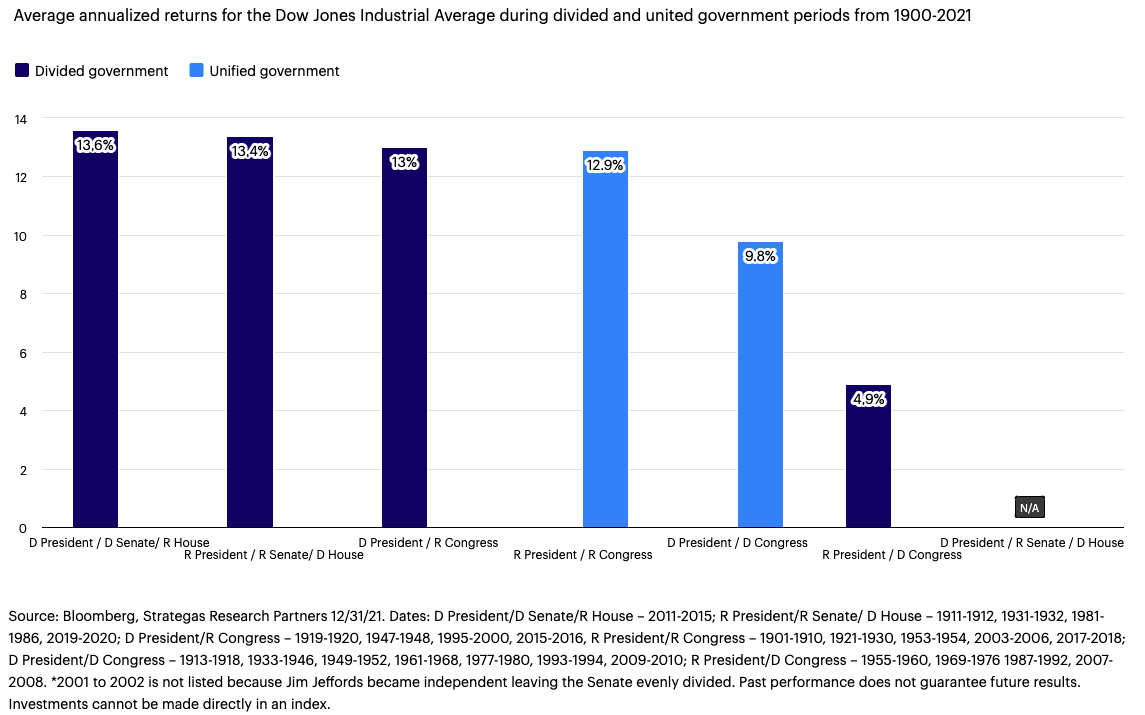
Markets seem to prefer divided government
However, this isn’t a statistically significant data point, and we’ve seen markets perform fine under single-party rule as well.
Politicians don’t dramatically alter economic growth
Since 1946, economic activity has been remarkably similar during single-party rule and divided government rule.
It’s almost time for the midterm elections! Or as David Letterman said, “It’s the day that Americans leave work early and pretend to vote.” I suppose that joke was more relevant before more than half of the population was working from home.1 Regardless of where we sit during the workday, where we stand politically has become increasingly more divided. In fact, surveys suggest that Americans are more divided now than we have been at any point since the US Civil War.2 I find that to be overwhelmingly sad and wish more common ground could be found. But while I don’t have an answer for that dilemma, I do have an answer for another question I get every two years: “How much do elections matter to markets?”
The answer: Not as much as you might think. In fact, I’d say financial markets really don’t care which party is in the White House or has the majority of seats in Congress.
Different parties, similar market returns
I recognize that I may have lost our more dyed-in-the-wool liberals and conservatives with the notion that elections don’t matter for markets. But facts are facts. Consider the last two elections. In 2016, we got a Trump presidency and single-party Republican rule. In 2020, we got a Biden presidency and single-party Democratic rule.
Drastically different outcomes, drastically different market reaction, right? Wrong.
- From the day Trump was elected (Nov. 8, 2016) to the end of 2018, the S&P 500 Index returned 22.3%.3
- From the day Biden was elected (Nov. 3, 2020) to the end of August 2022, the S&P 500 Index returned 20.6%.4
We’ve seen this before. The market posted near-identical returns over the two Reagan terms (207%) as they did over the two Obama terms (234%).5
Five things history has taught us about midterms and markets
Yet, investors continue to fret during election years. To (hopefully) ease their minds, I studied the history of US midterm elections and assessed the implications, or lack thereof, for the economy and the financial markets. Here are a few of the things I found:
- The equity market, since 1960, has been positive in each calendar year following the midterm.6 Coincidence? Perhaps, but markets do tend to prefer policy clarity over policy uncertainty, regardless of election outcomes.
- Markets seem to prefer divided government. This is an often-quoted fact. However, I would note that it’s not necessarily statistically significant. One hundred years may feel like a long time, but each of the combinations don’t occur all that often. Regardless, markets have done fine under single party rule too.
Partisan control: How have markets performed?
- Monetary policy will likely matter more. Past periods of easy monetary policy have brought strong market returns, and that’s been true under divided governments as well as single-party Democrat rule.7 In short, don’t fight the Fed. Today, the Fed has indicated that policy will tighten in the coming months, but peak policy tightening will likely occur before or just after the new Senate and House are seated.
- Politicians don’t dramatically alter economic growth. Since 1946, economic activity, represented by the median annualized quarterly percent change in US gross domestic product, has been remarkably similar during single party Republican rule (3.6%), single-party Democratic rule (4.4%) and divided government rule (3.7%).8
- The market’s long-term advance has occurred across many administrations and all different combinations of government rule.9 The Dow Jones Industrial Average, over the past century, across many different governing combinations, climbed from 100 to over 30,000.10
Conclusion
You can debate the merits of a trade war or government spending, which party had the better pandemic response, which party was ultimately responsible for inflation, or any other issue. But from a market perspective, it should feel like much ado about nothing.
Waiting to invest for when preferred political parties have held power, or worse yet selling when they don’t, would have had disastrous results for long-term investors, compared to a buy-and-hold strategy.11 So, root all you want. Carry signs that say, “Hooray for our side.” And, most importantly, vote. But be very careful to not allow political outcomes to disrupt your investment plans.
- Written By Brian Levitt
Footnotes
- 1 Source: McKinsey’s American Opportunity Survey 6/22. Results state that 35% of Americans have the option to work from home five days a week and 23% can do so part-time.
- 2 Source: United States Studies Centre, 2022.
- 3 Sources: Bloomberg, Invesco, 8/31/22.
- 4 Sources: Bloomberg, Invesco, 8/31/22.
5 Sources: Bloomberg, Invesco. Cumulative price return of the S&P 500 Index. Reagan’s presidency was January 1981 to January 1989. Obama’s presidency was January 2009 to January 2017.
6 Source: Bloomberg and US Congress 12/31/21. Based on the S&P 500® Index.
7 Sources: Goldman Sachs, Bloomberg, L.P.
8 Source: US Bureau of Economic Analysis, Invesco, 6/30/22.
9 Source: Bloomberg, Dow Jones, 6/30/22. As represented by the Dow Jones Industrial Average.
10 Source: Bloomberg, Dow Jones, 6/30/22.
11 Sources: Bloomberg, Invesco, 6/30/22. Study compares the performance of a buy-and-hold strategy versus only investing when Republicans or Democrats control the executive and legislative branches of government. A growth of $10,000 investment made in the Dow Jones Industrial Average in 1900 would have grown to $5,085,167 in 2021 under a buy-and-hold strategy. That’s compared to $102,595 investing only when Democrats were in control, $70,493 investing only when Republicans were in control, and $62,476 investing only in times of divided government. This is for illustrative purposes only and does not reflect the value of actual accounts.